In May 2020, real estate industry professionals had adjusted to transacting in a new normal, new listings hit the market en masse as showing freezes lifted, and the buyer demand that we still feel today took hold.
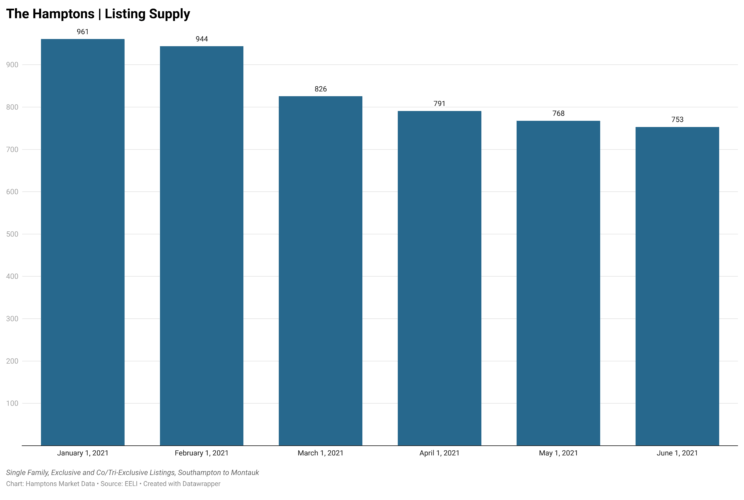
In May 2021, the market saw a slight uptick in new listings with a 3% increase over April, while contracts signed experienced a 16% decline. Yet the median number of days to contract decreased 35%, hitting an all time low of just 60 days. Supply dipped 2% for the overall market between May 1 and June 1 and has fallen 22% in 2021 so far, from 961 listings available for sale on January 1st to just 753 at the start of the summer season.

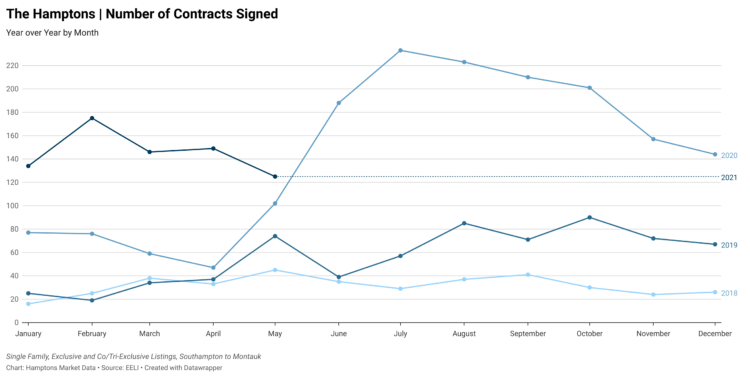
Contracts signed increased 26% year over year, from 102 to 125 contracts, but declined 16% from April to May. The number of sales also declined from April to May by 18%, from 176 to 145 listings sold.
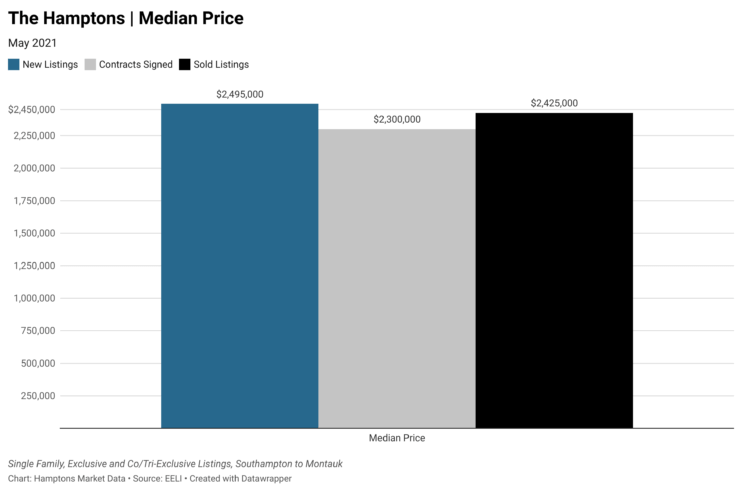
Percent differences overall are less extreme now than they have been in months past and the median list, last asking, and closing prices have, for the most part, aligned.

For anyone who has been wondering what the percent increase in property values in the Hamptons is as a result of COVID, May is a good month for this metric.
An already improving market leading up to COVID, May 2020 saw the closing of the majority of deals that were made just prior to and right at the start of COVID that had been delayed due to shutdowns. Properties closed in May 2020 for a median 6.81% off the listing price, in keeping with historic pre-COVID negotiability rates and reflective of the time the deals were made. However, the properties that went into contract in May 2020 ultimately closed for a median 2.61% off the listing prices. Enter the buying frenzy.
Fast forward to May 2021, though there is still a way to go, many aspects of life, as we were used to it, have or are returning to a semblance of normal. More of the population is getting vaccinated and economic forecasts remain positive. Generally, things are significantly more “normal” and impacts to the market today have more to do with COVID abating and good economic conditions than persisting directly related negative impacts. Builders may argue this point, but the increases in building material costs began prior to and were only exacerbated by COVID. May 2021 also saw a higher percentage of listings return to the market that had previously been listed than any other month of 2021 so far.
How much have Hamptons property values increased as a result of the pandemic? The median sold price increased 29% from $1,878,750 in May 2020 to $2,425,000 in May 2021. Considering properties going into contract in May are doing so at a faster rate than April and, from what brokers report, for continued record prices, Hamptons Market Data believes that overall, Hamptons property values improved around 30% over the course of the worst parts of the worst parts of the pandemic.
New listings coming to the market are trending up when broken down on a weekly basis and it looks like supply could be stabilizing, as the percent decreases in supply month to month have been lessening. However, the number of contracts signed in the month of May were still proportionately high compared to years past, even higher than in May 2020.

A closer look at specific areas and price points over the last 3 months shows that activity on properties priced $10M+ has increased. Appropriately, the odds of selling in Bridgehampton, Sagaponack and Water Mill, areas that are known for their larger South of the Highway estates, have also increased. The $3-9.99M price points have remained fairly consistent overall month to month in 2021, while the less than $3M price point has experienced a recent slight decline in activity.
However, the context matters. When measured against supply, and in the context of local market conditions, it is more likely that activity for properties below $3M is stalling due to lack of adequate supply more than being a reflection of the overall desire to purchase at these prices. It’s also worth mentioning that, as overall pricing continues to increase, there are fewer and fewer properties even valued below $1M.
The median days from list to contract was 60 days in May, whereas April had a median 92 days to contract. For more perspective, May 2020, the month that we first saw Hamptons properties flying off the shelves, had a median 223 days to contract. It is worthwhile to note that May 2020 offered more older inventory than exists today.
Properties in all price points, that are priced in keeping with recently sold comparable properties, are trading faster and for more money than at any other time in living memory.
Sellers, while still reaching for high list prices, are also responding to the market, evidenced by more properties priced under $5M closing for 10% or more off the list price than have in recent months. Real estate agents have also seen an uptick in price reduction email notices from fellow colleagues. It seems that holding out for more has become less comfortable.
The buyer demand in 2020 that became known as a ‘frenzy’, while still strong, has shifted to a more calm and calculated demand over the course of the spring. Buyers who are clearer on what they’re looking for are asking more questions during the purchase process, making more requests during negotiations, and are willing to wait if the right property or deal doesn’t present itself. But, according to brokers, they are committed to purchasing in the Hamptons.
This shift in demand and increase in price reductions does not indicate that prices are or will go down, but rather that sellers who initially were overambitious in their pricing are more motivated today to capitalize on continued strong demand while it lasts.
If positive economic conditions and the return to normalcy persist, Hamptons Market Data believes there is still strong evidence to suggest that while buying activity overall may continue to decline to normal market levels, pricing looks likely to continue to increase, even if only incrementally, going into summer 2021.
To view all of the Hamptons real estate market stats and charts, please visit hamptonsmarketdata.com.


