(Adapted from Hamptons Market Data for Behind the Hedges)
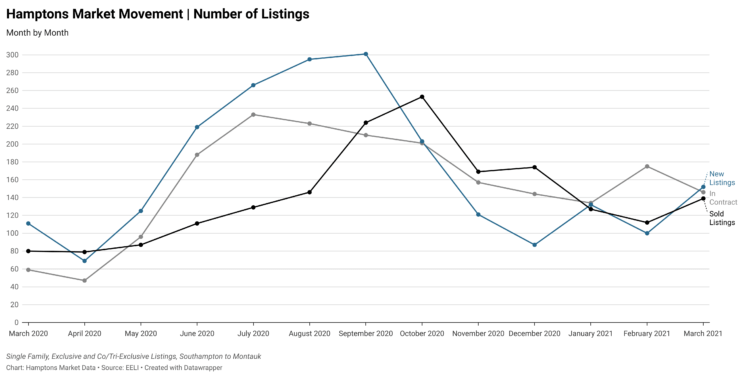
Statistically, the market is cooling off from where it has been, but is still piping hot. The chart below shows the market coming to equilibrium, as well as the rollercoaster of the last 12 months.
Increased pricing is the highlight of the Q1 2021 Hamptons story. March’s median sales price of $1,975,000 is a +41% increase year over year and +1% from February to March. For larger context, the median price for 2020 was $1.8M, 2019 was $1.525M, and 2018 was $1.545M.
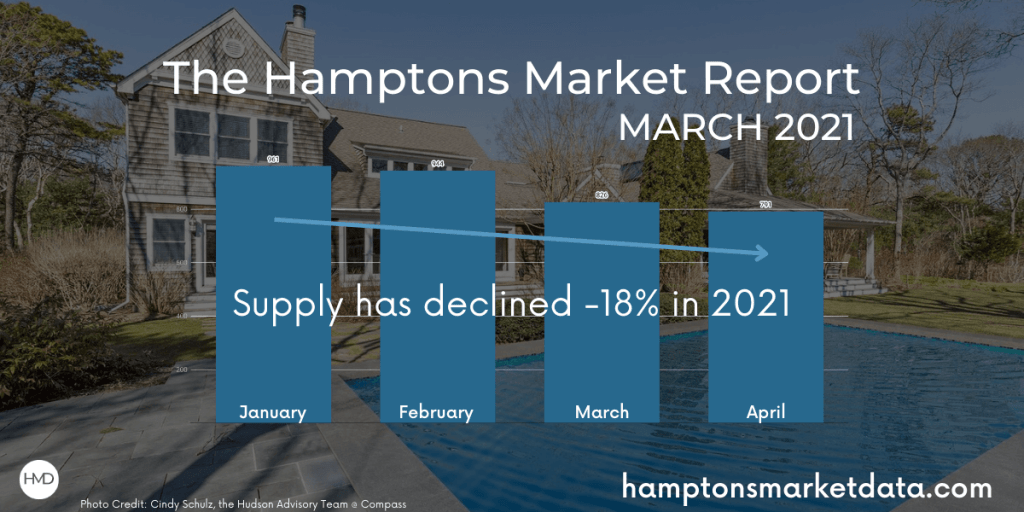
The overall market listing supply has steadily decreased in 2021, as new listings failed to keep up with demand in Q1 and closed listings finally caught up to past contract activity this March.
March 2021 was the first month since September of 2020 that new listings to the market outpaced the number of contracts signed. The number of listings that went into contract in March declined -17% from February, but was up +147% from March 2020 and was significantly higher than pre Covid-19 years. Buyer demand is still historically strong.
New listings increased +52% from February to March and, at 152 new listings, has now arrived at the normal monthly range for a typical Hamptons real estate market. If the trend continues, expect to see prices begin to cool off. Adequate supply levels need to sufficiently improve first, which could take a little or a lot of time. Sellers will decide. Pricing will continue to increase until they do. Important to note is that while new listings were strong in March, they came as an injection at the beginning of the month, but have been in decline week over week, including this beginning part of April.
This March, 41% of closed sales transacted for -10% or more off the property list price, while 24% closed at or above the list price. In February, this was 32% and 13% respectively. Overly ambitious sellers are growing more willing to negotiate and, on the other hand, as supply shrinks and demand continues its strength, 2021 is tracking to potentially have more bidding wars achieve over asking price deals, proportionately, than 2020.
The median days on market declined -32% March year over year from 302 to 205 days, but increased +17% from 177 days in February. The median days from list to contract increased from 140 days in February to 146.5 in March. However, going into Q2, most well priced, new to market listings are still finding contracts between 10 to 40 days, depending on the price point.
More and more, we are seeing evidence that regardless of the strong buyer demand, pricing high in this Hamptons market is leading to either sitting on the market or even larger discounts. Whereas pricing within market range increasingly leads to the likelihood of achieving an over asking price deal.
HMD took a look at all the stats and market aspects, including odds of selling, absorption rate, and specific area and price point breakdowns. The full March 2021 analysis, including charts and graphs can be found at Hamptons Market Data and I will continue the conversation weekly here at Behind the Hedges.
Adrianna Nava, founder and president of Hamptons Market Data, is a real estate investment strategist who specializes in The Hamptons real estate market. To read her previous column, click here.