In June 2020, the COVID buying frenzy was well underway. Real estate industry professionals watched in amazement as properties that had been on the market for years with no interest began to see bidding wars. The number of new listings to hit the market, as well as the number of contracts signed, recorded figures many had never experienced in their careers.
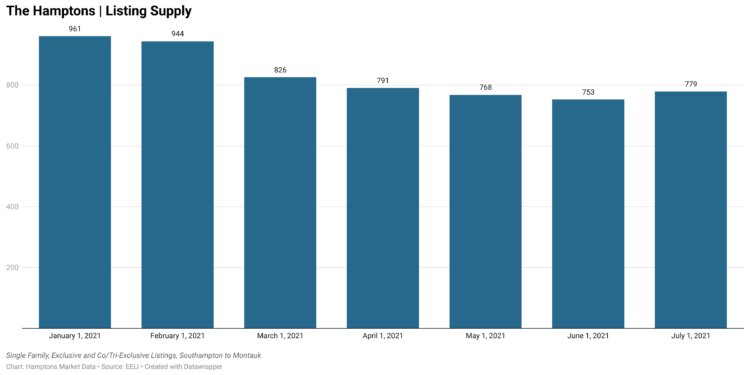
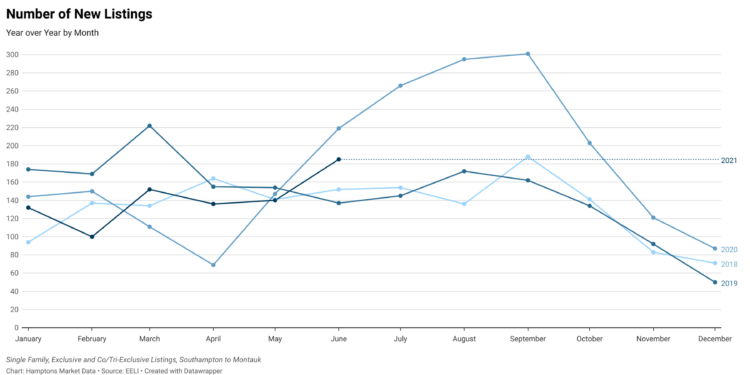
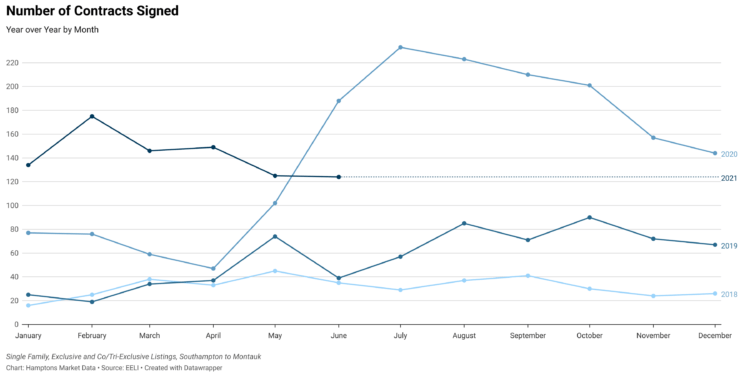
June 2021 started out with a depleted inventory, but over the course of the month, listing supply increased 3.5% to 779 listings available for sale on July 1, 2021. In the first half of 2021, the number of contracts signed peaked in February and has been declining since, while staying relatively stable at an only 0.8% decline from May to June 2021. The number of new listings has been on an increasing trend since February and had its largest increase between January and February.
June 2021 saw a larger percentage of properties that were previously listed within the last year come back on the market than any other month of 2021 so far. Re-listed properties are included in the new listings stats, as long as they had been off the market for more than 30 days. For buyers who have been looking in the marketplace for a while, true new listings are fewer than the numbers make it seem.
Though the number of contracts signed held stable between May and June 2021, there was a 37% decrease for June year over year, from 197 to 124 contracts. The buying frenzy has ended, but the level of contract activity is still 210% above pre-COVID levels for this time of year.
The number of sales declined from May to June by 21%, from 145 to 115 listings sold. There are still a lot of delayed closings, but they appear to be decreasing. In May 2021, 24% of sold listings took 90 days or more to get from signed contract to closing table. In June 2021, it was 19% and there were 13 less in June than in May.
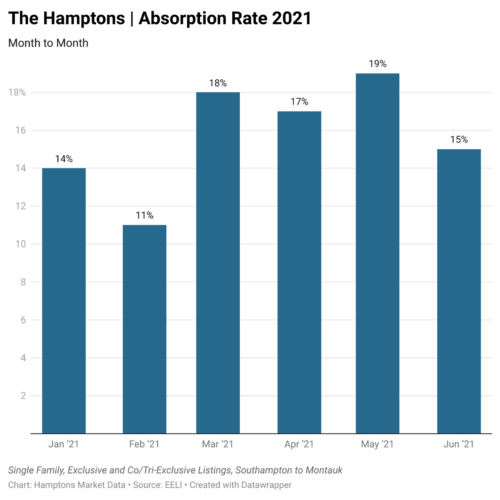
When looking at the last four months, the monthly number of new listings versus contracts signed have moved toward an equilibrium. The results are reflected in the 15% absorption rate for June 2021 being almost identical to the 15.6% average monthly absorption rate for the first half of 2021.
In May 2021, the data showed that more logic and thoughtfulness had entered the marketplace and June 2021 confirms this to be the current trend. While activity has been stabilizing overall, this new market still does not indicate that pricing necessarily will.
The median sold price in the Hamptons increased 29% from May 2020 to May 2021. Listings that sold in June 2021 closed for a median price of $2.1 million or 40% more than June 2020. The median contract price for June 2021 was $2,135,000 while the new listing median asking price was $3,195,000. The luxury market is active and overall pricing continues to increase.
The numbers can be deceiving however to property owners looking to price their homes, as these shifts hit areas and price points differently. For example, in the <$1.5 million price point, contract activity has been fairly stable over the last three months, as have new listings, but though new listings have finally caught up to the number of contracts signed in a month, in East Hampton 15 new listings came on the market while 21 contracts were signed. The continued depletion of inventory in this price point in East Hampton could likely spill into other areas as more inventory becomes available in those areas and buyers consider alternative options — like Southampton which had 6 listings sign contracts while 9 came on the market.
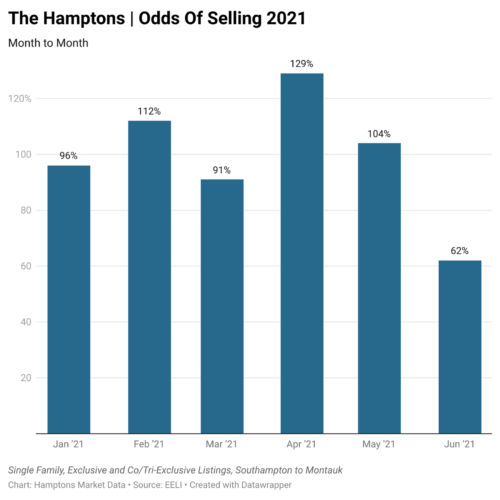
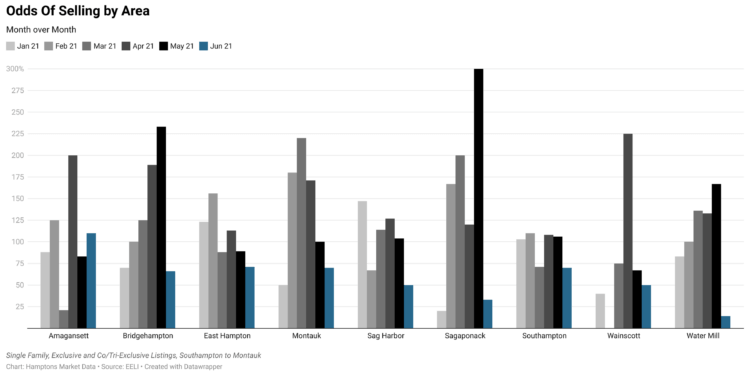
Overall, absorption rates are higher than they were in the beginning of the year, but have been declining over the last 2-3 months, depending on the price point. The odds of selling have also declined overall. As more inventory has become available for sale, fewer contracts have been signed and fewer listings have closed than in recent months; however Amagansett has seen an increase in odds of selling to 110%, above its 105% average odds of selling for 2021 so far.
In the $10M+ price point, 7 listings sold, 8 went into contract and 24 came on the market. In Water Mill, 3 contracts were signed while only 2 listings came on the market whereas in East Hampton, 3 listings came on the market and none went into contract.
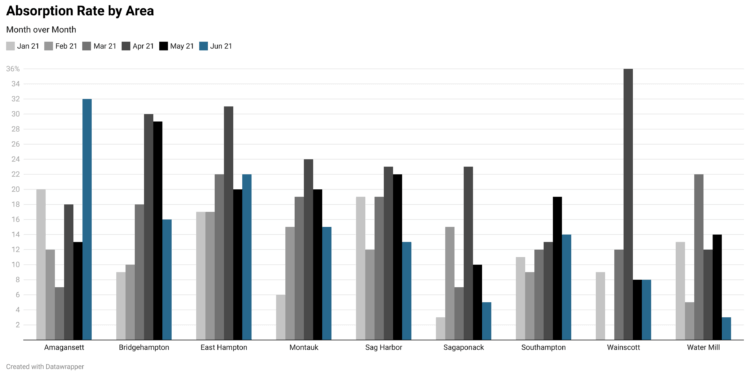
Amagansett had the highest absorption rate at 32%, while Water Mill had the lowest at 3%. Area and price point variations like these permeate the marketplace as the variety of buyers and sellers in the Hamptons adjust their way through 2021.
More on the Hamptons real estate market, including June 2021’s stats, charts and graphs can be found on HamptonsMarketData.com.
Adrianna Nava is a real estate transaction and market specialist. She holds her associate broker
license with Compass and is founder of HamptonsMarketData.com.