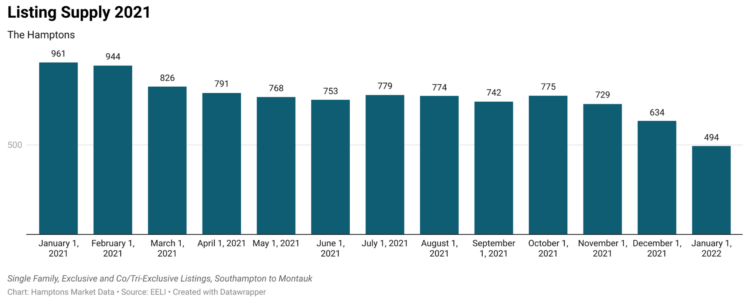
In 2021, sellers were 48.3% less negotiable and homes listed and closed 30% faster than in 2020. Listing inventory decreased 48.6% year over year, from 961 available listings for sale from Southampton to Montauk on January 1, 2021, to a meager 494 on January 1, 2022.
As December 2021 drew to a close, local real estate agents tended to agree with one another — people just don’t want to sell right now. They don’t have to sell, they don’t want to sell.
They speculated that the amount of inventory is a function of not only the new COVID landscape, but also the economic environment, including variables like attractive mortgage interest rates. With so much continued uncertainty, hard assets like real estate currently provide individuals who have disposable income with a safe and comfortable place to invest their funds — it’s quite a good time to purchase a first or second home in the Hamptons.
With a median sales price in December 2021 of $2.75 million, Hamptons homes increasingly became a luxury commodity. In 2021, 1.2% of homes priced below $1 million achieved a sales price over $1 million, compared to 1.1% in 2020, but only 0.01% in 2019.
Investing in the Hamptons comes with the added benefit of fulfilling a lifestyle choice more easily made as full and hybrid work from home options increasingly become norms. The homes can be luxurious, but the natural setting so proximate to New York City in particular, is irreplaceable.
The agents are only partly right, however. While the economy and COVID landscape do inform real estate transaction decisions today, as always, the numbers tell the full story, which involves taking a look at where we are compared to where we’ve been.
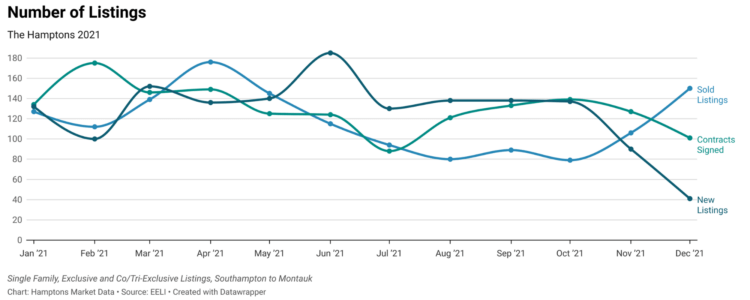
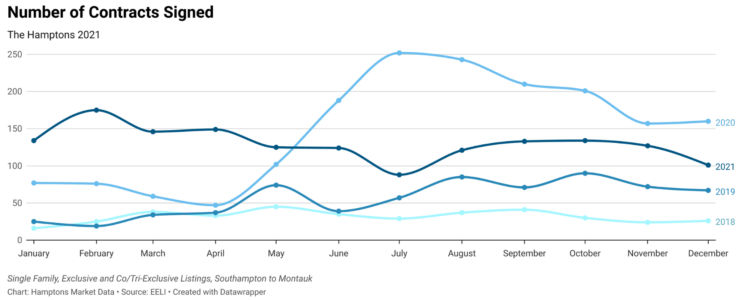
The month of December 2021 saw only forty-four new listings come on the market, while one hundred and one went under contract – a 77.8% difference in new supply versus buyer demand.
After an upward rollercoaster of new listings for the first four months of the year, while the number of contracts signed remained steadily high, once the spring selling market presented, new listings and contracts signed were neck in neck. But by June 2021, the start of the Hamptons summer season, the number of new listings to the market skyrocketed and then plateaued through summer. Contracts signed remained in a gradual decline through the spring selling market and into July.
As August drew to a close, real estate professionals believed that this was it — the bulk of COVID-related interest in the Hamptons was over. The market would begin to return to normal activity levels (this author agreed), including a settling of pricing as active buyers were likely to have more options amidst fewer buyers in the market (this author disagreed). It was also highly possible that some peak COVID buyers would feel purchase remorse and rush to sell (this author wasn’t so sure to make the declaration). None of this was to be.
How much of the current Hamptons real estate market condition is due to an increase in the number of people not wanting to sell, perhaps still due to COVID-related reasons, versus the general increase in housing demand alongside depleted inventory coming out of 2020?
The number of new listings coming on the market stabilized to “normal” (or pre-COVID) market levels as early as January 2021. While the number of contracts signed is no longer as high as the levels we saw in the last half of 2020, the number of contracts that were signed in the last quarter of 2021 was still 135% higher than the average of the pre-COVID fourth quarters of 2019 and 2018 combined. It appears as though the decision to purchase and relocate to the Hamptons, at least part-time, remains a strong trend going into 2022.
The large difference between the number of properties going under contract from June 2020 through December 2021 relative to the amount of new listings put on offer during the same time has taken an even bigger toll on the real estate market – that has only driven prices even higher than the massive rush on properties did in late summer and fall of 2020.
For example, a property that is currently under contract for 16% more now than it had been in the spring of 2021 only increased in value 3% between November 2020 and March 2021. During the last quarter of 2021 alone, Hamptons land listings increased approximately 10% in value.
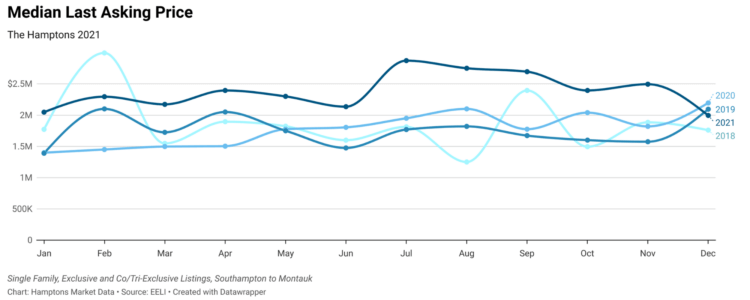
Sellers are asking more and buyers are paying more – reflected by the median last asking price trending up to the $2 million marker. The dip in the median last asking price for the month of December 2021 is explained by the fact that fewer properties over $10 million listed in December than during the fall and earlier in 2021.
From January 2018 to October 2020 the median listing discount, the difference between the last asking price and the price for which the listing actually closed, was less than 4% off only 5 times and never had been less than 3%. Since October 2020, the listing discount has been less than 3% seven times and has not seen 4% or more again.
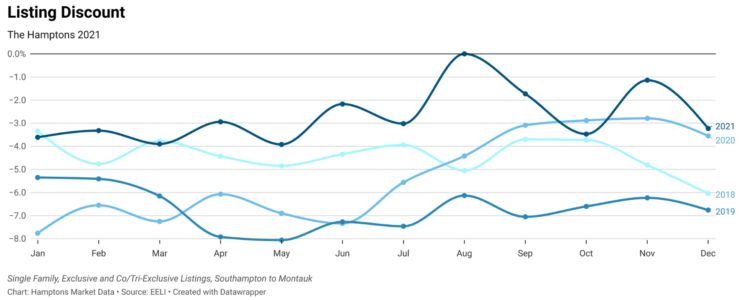
Properties have generally not been trading at discount, even when priced high, sellers are more likely to reduce their price to meet buyer expectations, than buyers are willing to bid low to the list price.
Buyers regained some power in 2021 compared to 2020, they could say things like, “get real or I’ll go somewhere else.” Sellers typically were responsive and reduced quickly when they initially had been 20% or more overpriced at listing. On the other hand, sellers who priced at or below market value often received 20% or over their asking prices out of the gate.
The days on market remained historically low. As this author predicted at the end of summer 2021, the number of days from listing to signed contract has increased. However, not for the reasons assumed. Instead of more available homes to choose from, December 2021 saw buyers circling back and bidding on listings that had been sitting on the market due to either overpricing or lack of desirable features.
In December, buyers once again began to make wishlist sacrifices simply to secure a Hamptons foothold. As a result, though 33% of the listings that signed contracts in December did so within 45 days of listings for sale, the median days from list to contract signed increased 41.7% from November to December 2021.
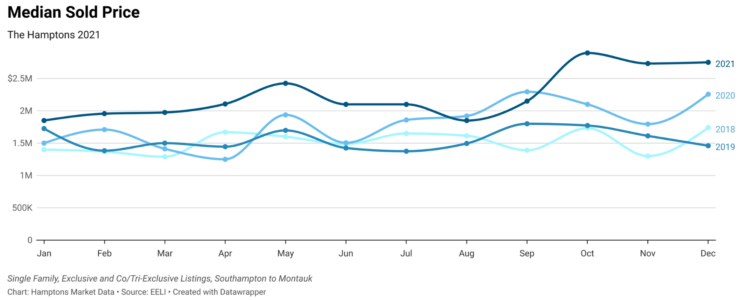
The annual median sold price increased 18.5% year over year, from $1,899,000 in 2020 to $2,250,000 in 2021. Sellers were 48.3% less negotiable in 2021 than in 2020 and homes listed and closed 30% faster in 2021. To view all the stats and charts, please visit Hamptons Market Data.
Adrianna Nava is the Hamptons real estate market expert. She is a licensed associate broker with Compass and founder of Hamptons Market Data.